Friday, March 27, 2020

Childhood Trauma: Adult Fatal Injuries


Childhood Trauma: Adult Fatal Injuries

Note: this is part of the Youth Suicide Rise project.


We discovered a strong correlation between youth suicide rates and cumulative risk of childhood exposure to suicide (as measured by all-age suicide rates), and we speculated this to be only one of a group of childhood trauma factors that have been increasing.

What other such factors could be involved?

Let us first examine fatal injury deaths among adults.  


Adult Fatal Injuries


Fatal injuries have increased greatly among 'parental' adults aged 30-59:


The increase since the start of the millennium was nearly 60% -- indicating that kids nowadays are more than half as likely to be exposed to an unexpected death of a parent or a similarly close adult.

Interestingly the Great Recession (2008-2009) did not lead to increases in fatal injuries among middle-aged adults -- if anything it may have stalled the ongoing trends.


The cumulative 7-year rate has has a similarly increasing pattern:


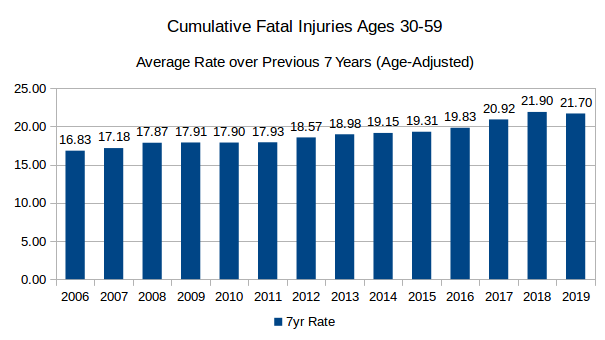
Why did fatal injuries rise so much for this age group?

To see this, it is best to look at rates by major types of fatal injuries:


We can see that even though suicide rose by nearly 40%, the main contributor has been drug overdose: it added about 280 deaths per million while suicide added only 50 and homicide 10.

In fact drug overdoses more than quadrupled since 1999 and more than doubled since 2007.

If we count only accidents -- thus ignoring suicide and homicide -- then the remarkable development is that in 2017 the majority of all accidental deaths among middle-aged adults was due to drug overdoses.

We can also look at the percentages:


The increases in drug overdoses were so dominant that the share of deaths declined for all other types of injuries, even suicide.


Deaths of Abandonment

A parental death due to suicide or drug overdose may be more damaging to a child psychologically than other deaths because the child may feel the parent did not sufficiently care about the child -- as if the despair or the addiction were more important than the child. 

If we sum up suicides and drug overdoses among middle-aged adults, the development was as follows:

1999: 213 deaths per million
2007: 323 deaths per million (50% increase)
2017: 530 deaths per million (65% increase since 2007, 150% increase since 1999)

Cumulative exposure over preceding 7 years:


Thus a teen in 2019 had nearly double the likelihood of having previously experienced a childhood trauma due to an 'abandonment' death of a parent or a similarly close adult.


Conclusion:

Childhood exposure to unexpected death trauma likely increased considerably; this is in part due to more suicides among adults but mainly due to a massive increase of drug overdose deaths among  middle-aged adults.


Notes

In 2018 there was a small decline in drug overdoses while suicide still increased slightly.

It is possible that some drug overdoses were undetected suicides; on the other hand, it is possible that some suicides were committed due to despair over addiction.  In our approach the differences in intent and motivation do not matter much since all such deaths may result in a similar trauma for a child feeling abandoned by such an adult.

We will examine young adults separately; we concentrated on middle-aged adults under the assumptions that this 'parental' group affects children the most among adults.

Another task is to look at youth suicide correlations with exposure to various types of adult fatalities (besides suicide) since the 1980s.

We should also keep in mind that all the data here is at aggregate levels; we have no correlations at the individual level. The possibility of ecological fallacy thus applies, but this is not yet an issue since we are merely searching for plausible theories -- not jumping to conclusions about causes.


Friday, March 20, 2020

Youth Suicide: Cumulative Adult Influence


Youth Suicide: Cumulative Adult Influence


Note: this is part of the Youth Suicide Rise project.


Our previous findings suggest the following implication:


The main factors that induce changes in youth suicide rates are those that accumulate during childhood and involve adults.


This is because correlation comparisons indicate that the cumulative past is a better predictor than concurrent events and that past adult rates matter more than past youth rates.

It is true that these correlations involve only suicide rates, but these rates are likely to be indicative of a number of related problems -- not just suicide -- that increase or decrease in similar manner over time.


Intermediate Factors

Even when X causes Y and X correlates highly with Y,  it does not follow that all -- or even most -- of the changes in Y are determined by X.

X could be just one of a family of intermediate factors that change in tandem due to an underlying factor Z:

Z --> X1, X2, X3 --> Y


To picture this, imagine a triangle with sides a, b, c and a circumference C = a+b+c.

Now if a 'zoom' factor z starts stretching and contracting the sides proportionally, the length of side a will over time correlate perfectly with the circumference, and yet side a will never cause more than half of the changes in C (since a < b + c in any triangle).

Exposure to suicide in childhood may very well increase suicide risk in youth but this is unlikely to be the main factor, despite high correlation.  Other factors, such as family mental health problems and dysfunction, including parental abandonment, could play a larger role, all in turn influenced by some underlying factor Z.

We will look into this matter -- a group of intermediate factors affecting youth suicide rates -- in more detail next.


Note:  News Media Coverage

The implication above may seem dubious to those whose information about youth suicide comes mainly from the news media, since stories about such tragedies typically tend to:

a) concentrate on recent events

b) identify problems with peers rather than adults.

News reporting on youth suicide, however, is likely to skew reality.  Just recall the number of stories about the very young, a very small portion of all child youth suicides; suicides by girls also dominate the news, despite boys committing suicide much more often.

Speed in news cycles is essential, and when media look for causes of child suicides, it is easier to quickly identify recent events than those several years in the past; it is also much easier to discover conflict with peers, which often occurs in public with many witnesses, than family dysfunction, which tends to occur in private (plus there are considerations for grieving parents).

Furthermore, whenever journalists do go into more depth or whenever additional sources (such as police reports or court documents) are available, it is often revealed that the child has been suicidal for a long time and that there was a high amount of family dysfunction, conflict or trauma.


Note: Suicide Exposure Impact

One reason to doubt the possibility that youth suicide changes are determined mainly by exposure to suicide trauma in childhood is that historical changes in rates would imply that most youth who kill themselves nowadays were previously exposed to such trauma.  This does not seem plausible.

Another limitation is this:  youth suicide rate (age 15-19) has increased nearly 70% since 2007, but general suicide rate increased by only 25%.  It is unclear why such a change should produce a much larger proportional change.


Tuesday, March 17, 2020

Youth Suicide: Adult versus Peer Influence


Youth Suicide: Adult versus Peer Influence


Note: this is part of the Youth Suicide Rise project.


Before we move on to the question of implications, it is important to quickly clarify one issue regarding the high correlation between youth rates and past suicide rates.

We concentrated on the matter of past versus present, showing that the correlation of youth suicide with general (all-ages) suicide is considerably higher if we use the average of the preceding 7 years than if we use the concurrent rate.


Adult versus Youth Influence

Let us now also examine the issue of adult versus youth past rates.  Needless to say, the general (all-age) rate is determined mainly by adult rates, so correlation will remain high if we remove children and even youth (i.e. anyone under 20).

Will it be, however, higher than the correlation of youth rates with their own past averages?

The answer can be see in the following chart:


The answer is there is a huge difference!

In other words, youth rates have a rather poor correlation with their own preceding 7 years, and yet very high correlation with the preceding 7 years of adult rates.


Note:  the difference is even higher if we compare child suicide correlations with child versus adult past rates.


Monday, March 16, 2020

Childhood Trauma and Youth Suicide Rates


Childhood Trauma and Youth Suicide Rates


Note: this is part of the Youth Suicide Rise project.


Does exposure to traumatic events during childhood substantially increase the risk of suicide several years later?

If such strong long-term effects are true, then the correlation of child suicide with overall suicide could increase if we instead average the overall rate across several previous years.  After all, the suicide rate in any given year indicates the likelihood that children have been exposed to suicide within family or community that year, a highly traumatic event.


Teenage Child Suicide 1997-2018

Let us compare visually how well the concurrent and past rates correspond with teenage child rates:


Note: the scales were modified to move the curves closer to each other


Here we see that the Child curve (blue) follows considerably closer the Past 7 Years curve (green) than it does the Concurrent Rates curve (red).

It is interesting to note that the greatest deviation of the blue curve from the green occurs in 2004 and 2005, precisely the years when child suicide is believed to have been affected by a youth-specific event (the black-box warnings controversy).


Visual inspections can mislead; let us include calculations:


Here the visual observation is confirmed by calculation: the R squared -- an measure of how closely the points fit with the regression line -- is much lower for the red Concurrent rates than it is for the green Past rates.

It is important to keep in mind that knowing the average rate over the past 7 years says nothing about the recent trend -- it does not tell us if rates were falling and increasing.  Furthermore, we are using past values of the general suicide rate, not child rate. And finally, we are not including the current year in the past rate -- the past rate is calculated strictly from preceding years.

In view of the above the correlation is remarkable both due to the close fit and due to the huge improvement over concurrent rates.


Youth Suicide 1990-2018

Will this result hold if we look further back?  The 1990s were a time of child suicide rates falling down as rapidly as they have climbed recently -- will the close relationship with past all-age rates break during this era?

Since the CDC WISQAR tool does not allow Custom Age Range selection before 1990, we have to switch to the predefined Age Group 15-19 (Youth) and see if our finding extends not only to the 1990s but also to a slightly older group of teens:


Once again we see that the blue curve (youth aged 15-19) is closer to the green curve (previous 7 years) than to the red curve (concurrent rates).

Let us confirm the visual observation with calculation:

Once again we see a very high correlation with the past and a huge improvement over the correlation with concurrent rates (R squared 0.92 versus 0.42).


Scale

It is important to note the scale manipulation used to position the trend curves closer to each other in the charts above: the all-ages scale on the left covers half the distance of the youth scale on the right.

What this means is that every change in all-ages rates is associated with a proportionally double change in youth rates:  when the all-ages past rate increases by 1 percentage point, the expected change in youth rates would be an increase of 2 percentage points.

This fact will be important once we discuss causality and impact.


Robustness

We need to keep in mind the possibility that the correlation was so high due to chance -- after all this is not a result based on a large number of data points. To test robustness, we should look further and deeper, e.g. longer into the past, or at international data, or at state data, or at subgroups such as girls.  If chance played a strong role here than we should quickly encounter far smaller correlations.


Implications

Even if the relationship we discovered is highly robust, great care must be taken regarding causality.  We will discuss potential implications of the high correlation in the next post.


Technical notes:

All rates are age-adjusted; this has a (fairly small) effect only on the all-ages rates.

Stretching the scales in the trend charts to position the curves close to each other is a geometric form of calculating linear regression.  To better understand this, note that the equations of both lines in the Correlation of Youth chart was roughly y = 0.4 x + 8, which in turn is close to the relationship between the left and right scales on the preceding Youth trends chart.

The scales on the correlation charts were not stretched -- they were merely moved in order to separate the two groups of rate points (thus the distances of the points from the regression line were not affected).


Saturday, March 14, 2020

Millennial Changes in Child and Adult Suicide


Millennial Changes in Child and Adult Suicide 


Note: this is part of the Youth Suicide Rise project.


Let us look at 'millennial' changes in suicide (from 2000 to 2018):


When viewed from the millennial perspective, child increases do not seem so extreme.

It is crucial to note, however, that child suicide increases are still far above young adult increases.

It is interesting that the young adults pattern here is the opposite of young adult patterns in The Rise: since 2000 young adult suicide rose more with increasing age, while since 2007 it rose less with increasing age.

In teenage children this reversal does not occur -- in other words, even in the longer-term 'millennial' rise there is something very different about children.

It is furthermore important to keep in mind that child rates actually decreased substantially from 1.5 in 2000 to 1.1 in 2007. 

The Rise is therefore all the more remarkable as a sharp reversal of previous trend.

To better see trend reversals, we can divide the last two decades into two periods:


Note that here the changes are averaged over the number of years in each period (7 and 11) so that the values now show average change per year.

The massive trend reversal is specific to children while middle-age adult rises are fairly slow and steady.  

Why is it that child suicide trends are so different from general adults trends?

We will soon see that there may be a simple answer once we examine the correlation of youth suicide with cumulative suicide rates -- an indicator of childhood exposure to suicide.


The Rise and Adult Suicide


The Rise and Adult Suicide


Note: this is part of the Youth Suicide Rise project.


Child suicide has increased much faster (131%) than adult suicide (23%) between 2007 and 2018.

Let us now look at the increases by adult age groups:


Here the rise for age group  10-14 is so extreme that it does not fit the scale; child suicide rise (131%) is also far above any adult age group (45% for adult teens).


Excess Deaths

Child suicide increases are far larger than middle-age increases even in raw numbers:  in 2018 there were 12 'excess' suicides per million people aged 40-44 above 2007 rates versus 43 'excess' suicides per million teenage kids.

The difference in cumulative total of 'excess' deaths (2008-2018) is even more pronounced:  for every 40-something suicide above the count predicted by 2007 rates there were 5 teenage suicides above that base.


Contrast with Young Adult Patterns

In adults below 40, there is a fairly linear pattern correlating younger age with greater increases; the rise among children aged 15-17, however, is more than double the rise predicted by this linear pattern.

In other words, even kids close to adulthood are a special category when viewed in the context of young adult patterns during The Rise.

Is this divide clearly visible even in the transition from age 17 to 18?   

It is: suicide increased 86% for 17-year-old kids but only 43% for 18-year-old adults!


Notes:

  • The transition from age 17 to 18 involves, besides legal adulthood, two major changes: the end of compulsory education and a massive decrease in time spent with parents. The question is: does either have anything to do with suicide rates rising much faster for kids?
  • A bit of a mystery:  the increases in age groups 40-54 are far below those of groups both younger and older.  The contrast between age groups 35-39 and 40-44 is especially sharp.
  • We have ignored the fact that adult rates have been increasing much longer than child rates -- we will take this into account in the next post.


Technical notes:

There were  were 889 excess suicides in age group 40-45 versus 5160 excess deaths in the teenage kids group (between 2008 and 2018 above 2007 rates adjusted for population size).  

There were actually fewer age 40-44 suicides in 2018 than there were in 2007 because the population size of this group declined by 10% while its suicide rate rose only by 7%.


The Rise: Excess Deaths by Child Age


The Rise: Excess Deaths by Child Age


Note: this is part of the Youth Suicide Rise project.


We noted previously that there were over 5 thousand total 'excess' suicides among children between 2008 and 2018 compared to suicide in the year 2007.

Let us now look at the excess deaths by age:


We see that the total number of excess suicides at age 14 to 16 is similar in size and close to those at age 17, even though suicide rates of kids age 14 are still much lower than those age 16 or 17.  

The reason for this is that suicide of younger kids has been growing faster than suicide of older kids during The Rise (e.g. from 1.8 to 6.1 for 14-year-old kids versus from 5.9 to 11.0 for 17-year-old kids).

Note that total excess deaths for teenage children (age 13-17) alone is over 5 thousand.  For all children it is above 5-and-a-half thousand.


Technical Notes:

The counts are adjusted for yearly population size to ensure increasing or decreasing numbers of kids at a given age did not skew the results too much.

Since the base of comparison are age rates in a single year (2007), the results should not be interpreted too specifically.  We saw previously, however, that the 'younger suicide rose faster' rule remained true when we compared 3 or 5 year averages.


Thursday, March 12, 2020

The Rise: Teenage Cohorts


The Rise: Teenage Cohorts


Note: this is part of the Youth Suicide Rise project.


The CDC data allows approximate tracking of age cohorts: a death of a 15-year-old boy in 2015 means he was born in 1999 or 2000. As we are interested in general patterns, we will ignore the ambiguity and presume such a child was born in 2000.

Doing so we can calculate Age Cohort suicide rates, and to further simplify we will only consider the teen years (age 13-17):


Here the label 04-08 means the kids in that cohort were 13 in 2004 and 17 in 2008 (and so born in 1991).

Thus the cohort who was 17 in 2018 ended up with an 83% higher teenage suicide rate than the cohort that was 17 in 2010.  Unless there are steep declines in 2019 and 2020, we can expect that current cohorts will have double the teenage suicide rates of the teens a decade before them.

Let us also look at girls separately:


There are no surprises here; the rise is similar but steeper: the latest cohort to reach adulthood experienced twice as many teenage suicides as most cohorts from the earlier part of the millennium.


Wednesday, March 11, 2020

The Rise: Tween Suicide Trends


The Rise: Tween Suicide Trends


Note: this is part of the Youth Suicide Rise project.


Let us now examine the 'tween' (age 10-14) share of youth (age 10-19) suicide to see if the faster rise of youth suicides was already a trend before The Rise.


We see that for tween boys the increases during The Rise were actually a reversal of the slight decline during the early millennium, with the smallest share occurring during the years 2006-2008.

Let us also look at the suicide rates trend of tween boys:


We see a sustained rise between 2007 and 2014, very similar to the rise in the proportion of youth suicides.  We also see that the large jump in 2017 did not produce a similar jump in the tween share of suicides -- this suggests that the factors behind male suicide increases may have shifted recently.


Let us now turn to girls:


For tween girls, there is no severe change until 2013, when there is a fairly stunning increase that has been largely sustained since.

To understand better what happened in 2013, let us look at tween girls suicide rates:


We see there is indeed a massive jump from 2012 to 2013. Moreover, the increase has been sustained in the following 5 years.  Indeed the divide between 2009-2012 and 2013-2017 is remarkable. 


Summary:  The tween share of youth suicides increased considerably during The Rise, especially for girls.  This was not a continuation of a previous trend for either boys or girls.  While the increase in tween boys share of youth suicide was the result of a slow but steady climb in tween boy suicide rates from 2007 to 2014, for girls this was the result mainly of a huge but sustained jump in 2013.


Notes:

I double-checked the CDC data to make sure there really is such a strong divide between 2012 and 2013 for tween girls:

2012 - 2013, United States
Suicide Injury Deaths and Rates per 100,000
All Races, Females, Ages 10 to 14
ICD-10 Codes: X60-X84, Y87.0,*U03

YearNumber of
Deaths
Population***Crude
Rate
20128510,109,7280.84
201314110,106,9331.40


Although such counts may be subject to some random fluctuations, it is important to note there was nearly no volatility in the years before and after, as can be seen from the rates chart.

The fact that rates remained as high for 5 years after 2013 suggests this was neither an anomaly nor some kind of CDC data collection error.

As to explanations, I've seen no clear evidence that there was a huge jump between 2012 and 2013 in the use of social media or smart phones by tween girls -- if there is such evidence it would be worth investigating further.

As to news media suicide coverage, there was Amanda Todd (15) in October 2012, Hannah Smith (14) in August 2013, and Rebecca Sedwick (12) in September 2013 -- plus a number of other widely covered suicides of young girls supposedly linked to bullying on Ask.fm. Considerable work would be needed to estimate if there really was a huge increase of girl suicide news coverage between 2012 and 2013 -- and how it proliferated among tween girls.


Does anyone have any other ideas for the sudden change?

Tuesday, March 10, 2020

The Rise: Age 16 and 17


The Rise: Age 16 and 17


Note: this is part of the Youth Suicide Rise project.


In The Rise: Age Trends we saw that suicide rates of younger kids increased more than those of older kids, and although this applied mainly to younger teen versus older teen age groups, there was also evidence that rates grew more for kids aged 16 than 17.

Let us now look closer at ages 16 and 17 by adding data from 2018 and then asking if the are are distinctions between boys and girls and what were the trends before The Rise.

First we will compare 3-year and 5-year aggregate suicide counts:


     2005-2007    2016-2018       Difference     Proportional
    2003-2007    2014-2018       Difference     Proportional
Boys 16yo52585933464%
899130840945%
Boys 17yo726103230642%
1192163043837%


Girls 16yo167351184110%
29354325085%
Girls 17yo16831815089%
27448521177%


We see that the increase was proportionally greater for boys and girls age 16 than age 17, be it by comparing 3-year or 5-year periods.

There is, however, a catch: the pattern nearly disappears for boys and reverses for girls when we compare just 2018 with 2007:


Year 2007Year 2018DifferenceProportional
Boys 16yo17429311968%
Boys 17yo22636313761%


Girls 16yo551095498%
Girls 17yo4110463154%


To understand the situation better, let us first look at the yearly ratio between suicides of boys age 17 versus 16:


We see that the ratio was high in 2005 and 2006, as well as 2008, so that 2007 is a local minimum.

As to long-term trends, until about 2008 the ratio appears to be increasing rather than decreasing, so the decline during much of The Rise is not a continuing trend from before (though due to the major fluctuations we should treat any such trends with caution).

As with boys, the ratio is very high in 2005 for girls:


The long-term trend, however, seems to be almost linear throughout the millennium: a slowly declining ratio subject to massive fluctuations in the first decade (thus again the trend should be treated with caution).


To summarize: the data is compatible with suicide rising faster among 16-year-old boys -- but due to high fluctuations it is difficult to link this trend to The Rise itself.  As to girls, the fact that suicide tends to peak at 16 rather than 17, coupled with massive fluctuations in the first decade, make any conclusion about general trends there very tenuous.


Notes:

The fluctuations often appear to be close to oscillations:  an increase is quickly followed by a decrease.  While this could be mainly due to random fluctuations being subject to the 'reversion to the mean' rule, it is interesting to note that the female 17 vs 16 ratio has been fairly stable since 2011 despite suicide being much less common among girls.

One possibility is that the oscillations are partly due to what we may call the Depletion Theory: the notion that being suicidal is the result of complex factors while suicide itself often appears to be 'triggered' by some event to which, however, those not already highly suicidal seem to be immune.

If this theory is close to reality, then if an event like The Great Recession triggers older teens more than younger teens there would eventually be a 'depletion' of the most suicidal older teens and thus the average suicide age of kids would first greatly increase but soon after greatly decrease.

The same would apply to oscillations of boys vs girls ratio and between other groups.

We will see later to what degree such a theory is compatible with data -- e.g. if being suicidal is less volatile than suicide itself and so on.


Technical note:  we used only second-degree polynomial to see if there is a significant distinction in trends between the decades (as it appears to be the case for boys but not for girls).


Monday, March 9, 2020

The Rise: Demographics


The Rise: Demographics


Note: this is part of the Youth Suicide Rise project.


Summary: Demographic shifts related to age, sex, race, ethnicity, region, and rural areas during The Rise do not explain any part of the increase in child suicides.


Let us now recapitulate some of the information we learned from the data regarding demographic shifts during The Rise (2007-2018):

  • Child population slightly decreased (by 0.8% from 74,019,405 to 73,399,342)
    • Thus suicide rate increased slightly more than suicide count
  • Teenage (higher rates) portion of child population slightly decreased (from 29.5% to 28.4%)
  • The mean age of a child decreased slightly (from 8.67 to 8.62)
    • Thus the age-adjusted rate increased more than the crude rate
  • Child suicide count increased 119%, rate 121%, age-adjusted rate 131%
  • Male (higher rates) share of child population decreased slightly (from 51.18% to 51.08%)
  • White (higher rates) share of child population decreased (from 76.7% to 74.9%)
  • Hispanic (lower rates) share of child population increased (from 21.5% to 25.2%)
  • Asian (low rates) population increased more than Native (high rates) population
  • NE (low rates) and MW (high rates) decreased decreased, South (lower rates) increased
    • This regional shifts 'cancelled' each other in relation to child suicide
  • Rural (higher rates) population decreased
  • Therefore basic demographic shifts did not elevate child suicide


Notes:

This is an example of a 'module' that collects information from previous analysis into a thematic unit.

Ideally, such modules would be linked to both the data and calculations, but there are technical reasons I have delayed this -- in the meantime here are at last the most basic numbers:


Demographic        Year 2007        Year 2018         Difference          %Difference
Child Population7401940573399342-620063-0.84%
Suicide Deaths8381834996118.85%
Suicide Rate per Million11.3224.9913.67120.70%
Age-Adjusted Rate10.5824.4113.83130.72%


Teenage Children (13-17)2180462020837856-966764-4.43%
Teenage Share of Child Population29.46%28.39%-0.01-3.63%


Boys3788387837490849-393029-1.04%
Male share of child population51.18%51.08%0-0.20%
Girls3613552735908493-227034-0.63%
Female share of child population48.82%48.92%00.21%


White5673348854980335-1753153-3.09%
White share of child population76.65%74.91%-0.02-2.27%


Hispanic1588670818701184281447617.72%
Hispanic share21.46%25.27%0.0417.72%


Technical notes:

The age-adjusted rates are based on presuming all child age cohorts equal in population.  This is different from the CDC approach, which uses a base year such as 2000 to compute the rates.  The reason CDC does this is old people -- it makes no sense to treat the 99-year-old cohort as being the same size as the 39-year-old cohort.  Our approach is, however, sensible for youth populations as long as child mortality rates are negligible (and offset by immigration).

The reasons I am delaying detailed calculations is that the data I have is in the form of disparate collections based on different population units -- not on single suicide cases.  In theory, one could try to unify these by obtaining 'atomic' population groups that are not possible to reduce further with the current CDC info, such as:

14-year-old male White Hispanic Northeast rural firearm suicide in 2012

but it turns out this would take countless downloads using the WISQARS tool.

Instead I will eventually attempt to obtain data from CDC at individual level and then redo everything in the statistical language R with scripts so that the calculations are easy to post online and thus be available for scrutiny by anyone.


Friday, March 6, 2020

The Rise: Suicide Methods (Girls)


The Rise: Suicide Methods (Girls)


Note: this is part of the Youth Suicide Rise project.


SummaryThere have been no major shifts in suicide methods among girls during The Rise.   The theories of increasing access to guns or prescription drugs are not supported by the data as explanations of any substantial part of The Rise.


A chart of suicide methods does not indicate any major proportional shift since 2007:


We see that while there was both an absolute and proportional decrease in firearm suicides early in the millennium (similar to boys), since 2007 all the three major methods started to increase similarly.

To make sure we did not miss a major proportional shift in the data, let us look specifically at shares of suicide methods during The Rise:


Despite 'wave' trends in methods there was no clear shift during The Rise -- in fact the share of suicides by method was nearly the same in 2018 as it was in 2007.

There was a minor shift of suffocation deaths replacing poisoning deaths during the first half of The Rise, but this trend reversed itself during the second half of The Rise.

Firearms rates have fluctuated somewhat without a clear trend.

Due to the absence of any major shifts in shares of suicide methods it seems highly unlikely that increased access to firearms or to prescription drugs has caused a substantial part of The Rise.


Notes:


See the note at the end of the The Rise: Suicide Methods (Boys) post.


The Rise: Suicide Methods (Boys)


The Rise: Suicide Methods (Boys)


Note: this is part of the Youth Suicide Rise project.


Summary:  There have been no major shifts in suicide methods among boys during The Rise.   The theory of increasing access to guns is not supported by data as an explanation of The Rise.


A chart of suicide methods does not indicate any major shift since 2007:


We see that while the start of the millennium saw a considerable decrease -- both absolute and proportional -- in firearm deaths, there has been only a minor sustained shift toward increased firearms share of suicide methods, and only starting in 2013.

As to poisoning suicides, there is no indication of any increase after 2007.

As more than 9 out of 10 suicides among boys are due to either firearms or suffocation, let us look at these two methods as shares of all male child suicide methods since 2007:


The proportional changes are too small to explain The Rise in terms of an increasing access to firearms, since one would expect far larger proportion of excess suicides to be firearm deaths.


Notes:


There is a difference between a theory being unsupported by data and contradicted by data.

The above data does not exclude the possibility of up to half the excess deaths during The Rise being due to increased access to firearms, but it does make it less likely because there would also have to be an independent factor driving up suffocation deaths that coincided with the access to firearms factor in both timing and intensity.  To complicate matters, the factor behind increased suffocation would have to have much smaller effect on firearm deaths. Due to these reasons it seems unlikely that increasing access to firearms is a major force behind The Rise.  (Formalizing such probabilistic reasoning is not trivial but it is sound -- see Bayesian inference and Occam's razor.)


Thursday, March 5, 2020

The Rise: Region and Rurality


The Rise: Region and Rurality


Note: this is part of the Youth Suicide Rise project.


Regions


The rise in child suicide was substantially smaller in NE that in the three other regions:


While subgroups based on sex/race/ethnicity tend to have higher increases when they have lower suicide rates, regions reverse this trend, since the Northeast has had substantially lower child suicide rates than the rest of the country.


Rurality

Rural areas had a slightly higher (130%) increases 2007-2018 than non-rural areas (120%), also despite starting with already higher child suicide rates.


Demographics


The Northeast and Midwest lost some child population while the South gained some:


It turns out these changes essentially cancel each other in regards to rates, since the Midwest has high rates and the South just below average rates; thus the predicted 2018 child suicide rate -- based on changes in regional population but no changes in regional rates -- remains the same as in 2007.

Rural child population decreased by about 7% while non-rural population remained nearly the same (about 0.2% child population gain).

To summarize, regional and rural demographic shifts explain no part of the rise -- if anything, the decreasing rural population would predict lower rates in 2018.


Notes


The CDC WISQARS tool offers two 'metro' classifications: based on 2006 data or 2013 data.  Since 2013 is midpoint between 2007 and 2018, we use this classification.  Using the 2006 metro classification leads to very similar results.  Using the 2006 classification for 2007 and the 2013 classification for 2018 would lead to a greater loss of 'rural' population but once again similar results regarding child suicide rates.  Ideally, there would be a metro classification based on 2017 data, so we could use a proper 'dynamic' method of classifying rural areas -- the results would presumably be similar, except the loss of 'rural' population would be even greater.


Simpson's Paradox


According to the 2013 metro classification, the child suicide rates in 2018 were 2.29 for rural and 3.80 for non-rural areas, while according to the 2006 metro classification, the child suicide rates in 2018 were 2.27 for rural and 3.76 for non-rural areas -- thus the latter partition has lower rates for both rural and non-rural areas yet the overall rates must be necessarily the same (2.50):

M1 partition: 2.29 rural, 3.80 non-rural, 2.50 overall
M2 partition: 2.27 rural, 3.76 non-rural, 2.50 overall

This is a nice illustration of Simpson's 'paradox'.


The Rise: Race and Ethnicity


The Rise: Race and Ethnicity


Note: this is part of the Youth Suicide Rise project.


Between 2007 and 2018 the child suicide rates increased (proportionally) the greatest for Asian girls (who started with very low rates) and the least for Native American boys (who started with extremely high rates):


Changes between 3-year periods 05-07 and 16-18 show a less extreme gain by Asian girls but also show a slight decrease in suicide for Native American boys:


Ethnicity


Hispanic rates between 2007 and 2018 increased by 132% for boys (above the 104% male child average) and 178% for girls (nearly the same as the 181% female child average). Change from 05-07 to 16-18 was 70% for boys and 116% for girls, close to the averages for all boys and girls.


Demographic Shifts


Demographic shifts between 2007 and 2018 were small and mainly in the direction of decreasing child suicide: White population decreased by 3% and non-Hispanic population decreased by 6% (both groups having higher suicide rates than their complementary groups).


Summary


The child suicide rise is the greatest among Asians and the smallest among Native Americans, the groups that have respectively the smallest and largest child suicide rates.  Black girls also have elevated increases but smaller rates. Racial and ethnic demographic shifts do not explain any increase in suicides.


Notes:

The suicide rate for Native American girls jumped from 19 in 2017 to 32 in 2018, which explains the discrepancy between the first two graphs. With counts so small it is best to consider aggregate data.

The Native American group is termed 'American Indian / Alaskan Native' in the CDC WISQARS tool and it seems to consist of mainly 3 distinct native groups: Alaskans and Hispanic/non-Hispanic Americans.


CDC and YRBS: Time for Transparency

   CDC and YRBS: Time for Transparency This post is related to the  Youth Suicide Rise  project CDC response to Washington Post questions re...