Saturday, February 29, 2020

Female Share of Youth Suicides


Female Share of Youth Suicides


Note: this is part of the Youth Suicide Rise project.


We saw in The Rise: Sex Ratio Trend that the ratio between suicides by boys versus girls has been (mostly) declining since at least the start of the millennium.

Perhaps the most intuitive view of this trend is to look at the female share of youth suicide over the years:


Note that the 3-year (tween and teen child) and 5-year (youth) Moving Average green line values are displayed at the endpoints and so any 'green line' trend implicates all the previous 3 or 5 years.

From the graphs it is clear that the trend of increasing female share of child or youth suicides started about a decade before 2008.

Let us examine with particular care the 10-14 age group -- the one where suicide gains among girls are proportionally the greatest -- by looking at its 3-year moving average:


With 3-year accumulation it is especially clear that the most recent rise in female share of tween suicides -- even discounting the strong reversal in 2017  -- is not exceptional.

We can identify 3 instances of a rise followed by a momentary decrease:

From 1999-2001 to 2004-2006: 1.7 percentage points per year
From 2005-2007 to 2008-2010: 1.6 percentage points per year
From 2010-2012 to 2014-2016: 1.9 percentage points per year


Summary


The recent rise of the female share of youth suicide is not particularly stronger than the trend established in the early part of the millennium.  This is true even of tween girls, whose suicide rates rose the fastest.


Note:


This issue is important partly because some researchers and journalists may mistakenly assume that any factor primarily responsible for the rising child suicide must be also responsible for the concurrently rising female share of child suicide -- and thus be affecting (proportionally) girls much more than boys.  This need not be so.


Technical note:

All share values were computed from suicide rates rather than from suicide counts.

The rates used to calculate the female share of suicides for age group 10-14 as well as 15-19 were age-adjusted (as calculated by CDC based on the 2000 demographic data).  The rates used in the teen (13-17) group calculations were crude rates (the WISQARS tool is inconsistent in this regard).  The difference should be insignificant (demographic shift are very small and slow).


Thursday, February 27, 2020

The Rise: Sex Ratio Trend


The Rise: Sex Ratio Trend


Note: this is part of the Youth Suicide Rise project.


We have seen that suicide rates have increased proportionally more for girls than for boys since 2007.  Let us now look at the suicide rates sex ratio trend since 1999:


We see that 2007 was an anomaly but that there was indeed a steady decline between 2010 and 2016 in the ratio of suicides between teen boys and girls -- however, this trend is merely a continuation of a trend that started before 2007 and goes back to at least the beginning of the millennium.

To see an even longer trend, we have to combine ICD-9 and ICD-10 data for age 10-19 groups:


The graph indicates that the sex ratio of teen suicides has been generally declining since the mid-1990s (polynomial trend) or at least since the start of the millennium (5-year averages).

Since child suicides are dominated by the oldest kids, and the previous data included adult teens, we should examine 'tween' children (age 10-14) separately:


Once again we see the downward trend since 2007 is merely a continuation of a previous trend, and actually appears to be slowing down.

Since the tween group suicides are mostly due to deaths at age 14, let us finally look at age 12 and 13:


This graph should be interpreted with caution, since some death counts for girls were at times below 20 in the early millennium years, and we can see the ratio is fairly volatile.  Once again, however, the data fails to support the notion that, even at the ultimate 'tween' age 12-13, the sex ratio trend has changed much since around 2007.

To summarize:  there is a long-term 'closing gap' trend of declining ratios between suicides by boys and girls, and this trend has not significantly accelerated during the recent child suicide rise period.

What changed is essentially this: between mid-1990s and mid-2000s, suicide rates have been mostly decreasing faster for boys than for girls, and since 2007 suicide rates have been mostly increasing  slower for boys than for girls.

The simplest model is that since mid 1990s the same factors have been slowly lowering --  modulo strong fluctuations -- the sex ratio of child suicides, and this is why suicide rates have been rising faster among girls than among boys recently.


Technical Note:


The CDC WISQARS tool does not always display age-adjusted rates, so we looked only at age 13-17 (instead of 0-17) to lessen possible effects of shifting age demographics.

The 5-year moving average green line values are set at endpoints, and so the start of any downward trend implicates the previous 5-year period.


Wednesday, February 26, 2020

The Rise: Sex and Age


The Rise: Sex and Age


Note: this is part of the Youth Suicide Rise project.


Suicide Rates for Tween Girls Quadrupled


Let us look specifically at a 'tween' category (age 10-14):


We see that compared to 2007, age-adjusted suicide rates in 2018 have tripled for tween boys and quadrupled for tween girls. Although increases are smaller using longer periods, it is important to keep in mind that unless the rise reverses soon, even cumulative data over 3 and 5 years will show extreme increases.


Suicide by Sex and Age


To consider smaller age groups, we will look at suicide deaths over cumulative 5-year periods in order to decrease volatility:


When we looked at age increases, we saw that switching to 2000 instead of 2006 (as the 3-year period midpoint) evened out rise disparities between ages 12 to 15. Let us implement a similar switch (using 5-year periods) when examining sex and age:


We see that for 12 and 13 year old girls, the rise remains extremely high, both in absolute terms (tripled deaths) and in relative terms (compared to older girls, whose rates roughly doubled).


Notes:


We used death counts because demographic changes have been slow -- comparing rates would lead to similar results.  We first used age-adjusted rates for 'tween' kids to demonstrate these extreme rises are not due to demographic trends.

Compared to 2007, the rates for tween girls are 17% higher in 05-07 and 28% higher in 03-07 -- these differences are not so large as to prevent eventual quadrupling of tween rates even at 3 or 5 year intervals if the current trend continues.

We calculated rates for 3 and 5 year periods merely as the average of yearly rates -- this may differ slightly from the rate calculated directly from deaths and population over this period.


Tuesday, February 25, 2020

The Rise: Boys and Girls


The Rise: Boys and Girls


Note: this is part of the Youth Suicide Rise project.


The child suicide rise has so far led to over five thousand 'excess' deaths between 2008 and 2018: over 3 thousand boys and 2 thousand girls.  Even if 2018 was the nadir of the crisis and child suicides will decline as fast as they rose, the total cost will be well over 10 thousand boys and girls.

Five Thousand Excess Deaths


Had the number of suicides remained at 2007 totals, there would have been 3181 fewer fatal suicides among boys and 2091 fewer fatal suicides among girls between 2008 and 2018  -- a total of 5272 excess deaths:


This total would be somewhat higher if adjusted for age demographics (both child population and its teen component has been declining) and even higher had short-term and long-term trends before 2007 been taken into account since male child suicide was slowly declining (female child suicide was stagnating).

If we examine 3-year and 5-year periods, we still find massive amounts of excess deaths among both girls and boys:  844 girls and 1506 boys in just 2016-2018 (nearly 800 yearly) compared to 2005-2007, and 1194 girls and 1952 boys for a total of 3146 in 2014-2018 compared to 2003-2007.


Proportional Increases Larger for Girls


Although excess child deaths from 2008 to 2018 (compared to previous periods) are mostly male, proportional increases were far greater for female children:


Note:

We will look at the combined sex and age characteristic next, and sex ratio after that.


Friday, February 21, 2020

The Rise: Age Trends


The Rise: Age Trends


Note: this is part of the Youth Suicide Rise project.


Child suicide rates have climbed steadily between 2007 and 2017 across the age spectrum:


Accumulating data over 3-year periods removes all volatility:


Since we stretched the timeline back to 2000 (midpoint of 1999-2001), we can see that recent rates significantly surpassed rates at the start of the millennium by year 2012 for ages 12-15 but not until year 2014 for those aged 16 and 17.


Younger Rates Increased Faster


Comparing 2006-2008 with 2015-2017 shows that suicide among younger teens grew faster than among older teens:


Rates for age 12-14 more than doubled, while those for 15-17 less than doubled.

Is it possible that these differences are due to larger decreases among younger kids in early millennium years?  Let us compare current rates with 2000 as midpoint:


We see that switching to 2000 as the base midpoint evens out the rise in ages 12 to 15, but the rates for these younger kids have still increased substantially more than for nearly adult teens.


Excess Deaths Largest for the 16-year-old Age Group


The total numbers of 'excess' suicides are still higher among older teens, as can be seen if we count 'extra' deaths per 4.2 million (close to the average size of age cohorts) in 2015-2017:


The numbers represent the amount of 'extra' deaths in 2015-2017 if suicide rates could have remained the same as in 2006-2008 and age cohorts were uniformly 4.2 million in size.  With preteens included (about 70 'extra' deaths) the overall number of excess suicides in 2015-2017 amounts to well over 2000 deaths.

The chart also reveals that the 'younger rates rise faster' phenomenon is so strong that 'excess' deaths are the largest for 16-year-old instead of 17-year-old children.


Notes:


The average size of an age 12 to age 17 cohorts in 2017 was about 4.2 million (4,209,527).

Is it possible that child suicide rates increased in part because teens have become -- be it due to rapidly changing birth rates or due to immigration trends -- a larger part of the child population?

The answer is no: the teenage portion of child population actually declined between 2007 and 2017 (from 29.5% to 28.4%).


Wednesday, February 19, 2020

Child Suicide: Methods


Child Suicide: Methods


Note: this is part of the Youth Suicide Rise project.


Nearly all children who killed themselves in 1999-2017 used either firearms or suffocation, with girls also using 'poisoning' (mostly intentional drug overdoses):


The CDC 'poisoning' category is split between 'drug' and 'non-drug' components, and 9 out of 10 such poisonings by children are classified as 'drug poisoning'.

No other method -- falls, cuts, fires, drowning, or transportation (presumably walking into traffic) -- amounts to more than 2% of all boy or girl suicides.

Firearms were used by the majority (53%) of non-Hispanic White Teen Boys.


Notes:

Suicide deaths due to cutting, the method used by the lead girl in the TV show 13 Reasons Why, are extremely rare among children, with only 41 cases classified as 'cur or pierce' in the CDC data from 1999 to 2017.

Black teen boys are a lot less likely than White teen boys to intentionally kill themselves with a firearm (rate 1.8 vs. 4.01) but they are far more likely to be killed by a firearm (rate 24.21 vs. 7.31).

The comparatively low numbers of fatal intentional (drug) poisoning means that a higher deadliness of OTC/Prescription/Illegal drugs is an unlikely explanation of the huge rise in child suicides, at least for boys (but we will certainly examine the numbers carefully, especially for girls).

On the other a higher proportion of firearm suicides in 2017 over 2007 could account for a large portion of excess child suicides, perhaps due to easier access to firearms by children.

We will look at any time trends in suicide methods soon.


Tuesday, February 18, 2020

Child Suicide in Context of Adult Suicide


Child Suicide in Context of Adult Suicide


Note: this is part of the Youth Suicide Rise project.


Child suicide rates are obviously far below adult rates (1.54 vs 6.34).

The boys to girls suicide ratio (2.22/0.83 = 2.7) is lower than the adult male to female ratio (25.15/6.34 = 4.0).

Let us now look at the following (more relevant) subgroups:

Teen Children (TC 13-17), Teen Adults (TA 18-19), Young Adults (YA 20-29), Middle-aged Adults (MA 30-49):


We can see that male and female suicide rates increase with advanced age in a different manner: for boys from rapid to slow, while for girls the gains are fairly linear.

Let us examine the transition from childhood to adulthood in more detail:


Now we see that female transition is more nuanced ('wavy') than male transition, and that age 21 rates are far above age 15 rates for boys (331%) but much less so for girls (145%).


Notes:


The middle-age adults (MA) group includes the bulk of parents with minors (the current mean age of mothers at birth is 29 years, first-time mothers is 27 years).  This age group will play a more important role later, as we will look at potential parental factors influencing child suicide.


Monday, February 17, 2020

Child Suicide: Regionality and Rurality


Child Suicide: Regionality and Rurality


Note: this is part of the Youth Suicide Rise project.


Regions


Child suicide rates (1999-2017) differ considerably by region: the Northeast has by far the lowest rate (11) while the South (15), the West (17), and the Midwest (18) have average rates (the US rate being 17 per million).

The Northeast rates remain considerably lower for teens and teen girls as well. 

Restricting rates to non-Hispanic White Teen Children leads to only slight changes: while the Northeast still has by far the lowest rate (42) and the South and the Midwest have average rates (62-63), the West has a slightly elevated rate (69).

We can therefore see that the low suicide rates in the Northeast are not due to demographics, at least not basic race/ethnicity/sex/age factors.

Rurality


The CDC WISQARS tool has a new classification "Metro Areas" that includes over 82% of the 1999-2017 child population; I refer to this section as 'rurality' in order to reflect the fact that the CDC non-Metropolitan areas seem to correspond to what the Census Bureau defines as rural areas.

Rural areas have over 50% higher child suicide rates compared to Metro areas (2.21 versus 1.43), an imbalance that increases to 63% for boys but decreases to 34% for girls.

When restricted to non-Hispanic White Teen Children, rural areas still have markedly elevated rates for boys (32%) but not for girls (4%).

Regions and Rurality


There are noticeable differences in the rural/metro ratio among the four regions:


Metro Rural Ratio Rural/Metro
NE   3.88 6.18 1.6
S    6.20 6.48 1.1
MW  5.91  7.08 1.2
W    6.44 9.89 1.5
Rates displayed only for non-Hispanic White Teen Children.

Therefore after we restrict our population to non-Hispanic White Teen Children, the elevated rural rates occur only in the Northeast and the West regions.

Northeast Redux


We therefore see that the Northeast exception is further nuanced since, modulo race and ethnicity, its rural rates are not much lower than those in the South or the Midwest. 


Notes:


Rates are over the cumulative 1999-2017 period, and so should be fairly robust for large subgroups of the child populations.


Sunday, February 16, 2020

Child Suicide: non-Hispanic White Teen Children


Child Suicide: non-Hispanic White Teen Children

Note: this is part of the Youth Suicide Rise project.


Whenever there is the possibility that racial, ethnic, or age factors strongly affect patterns and trends of interest, we might examine the following group:

non-Hispanic White Teen Children (age 13-17)

nHWTC

This somewhat convoluted construct has the important property of describing a group fairly homogeneous in terms of race, ethnicity, and age, and yet accounting for two thirds of child suicides between 1999-2017.

When need be, we will also split the group into its male and female components: nHWTB (boys) and nHWTG (girls).


The progression of proportionality in relation to 1999-2017 suicides is as follows:


All child suicides 100%, 13-17 suicides 93%, 13-17 White suicides 78%, 13-17  non-Hispanic White suicides 66%.

Boys:
All (male) child suicides 100%, 13-17 suicides 93%, 13-17 White suicides 79%, 13-17  non-Hispanic White suicides 67%.

Girls:
All (female) child suicides 100%, 13-17 suicides 93%, 13-17 White suicides 76%, 13-17  non-Hispanic White suicides 61%.

Note that White and non-Hispanic White girls represent a bit smaller majorities in their category than their respective male counterparts.


The use of the nHWTC group will be demonstrated in the next post analyzing regional and rural patterns of child suicide.


Notes:


The progression of rates is as follows (All, TC, WTC, nhWTC):

  • US
    • 1.54 4.99 5.46 5.96
  • US Male
    • 2.22 7.16 7.90 8.75
  • US Female 
    • 0.83 2.70 2.89 3.02


Although there appear to have been no rapid changes in birth rates, there may be significant differences in age demographics over longer periods of time or between regions, especially once immigration is taken into account.  It is therefore important to also restrict scope to the Teen Children group (age 13-17) that comprises nearly all child suicides (93%).


Saturday, February 15, 2020

Child Suicide: Race and Ethnicity

Child Suicide: Race and Ethnicity


Note: this is part of the Youth Suicide Rise project.


Race


The child population in the CDC 1999-2017 database is about 75% White, 15% Black, 5% Asian and 2% Native American.  Suicide rates are about 10 per million for Black and Asian children, 17 per million for White children, and (disturbingly) 31 per million for Native American children.

Consequently, 83% of child suicides in 1999-2017 were committed by White children.


Ethnicity


Hispanic children constitute nearly 22% of the population, an ethnicity that is mostly White (90%) yet has considerably lower suicide rates (roughly 10 per million); the ratio of suicide rates for non-Hispanic versus Hispanic Whites is about 1.5 to 1.

Sex and Race or Ethnicity


White and Black boys commit suicide about 2.7 times more often as girls, whereas the ratio is about 1.9 among Asians and 1.7 among Native Americans.

Among Hispanics, about twice as many boys as girls commit suicide.

Age and Race or Ethnicity


Black preteen children kill themselves slightly more often than White preteen children, but White teenagers kill themselves considerably more often than Black teens.  White boys commit a somewhat larger portion of male child suicides (83%) than the portion (76%) of female child suicides committed by White girls.

Other than that, there seem to be no surprises in age patterns related to race or ethnicity, including sex.


Notes:


Native American children who are Hispanic have far lower suicide rates than non-Hispanic Native American children (about 4 versus 48 per million).  In concrete numbers: of the 739 child suicides (1999-2017) among Native Americans, only 39 were Hispanic even though Hispanics compromise nearly 40% of this racial group.  This is unlikely to be a mere statistical anomaly, since Hispanic Native American children number over half-a-million.

Since our concern is the recent rise of child suicide rates, we will not always analyze aspects of child suicide that can be important in other regards but are statistically too small to have explanatory power in relation to the doubling of rates.  For example, we will not investigate much deeper the suicide rates of sexual minorities and certain racial minorities (such as Native Americans), even though such analyses can be of great importance to both researchers and practitioners in relation to many other aspects of child suicide.


Technical Note:


The so-called Mekko chart would have been preferable for the "Percent of Population and Suicides by Race" graph, but there seems to be no way to produce such a chart in LibreOffice -- if anyone knows of a way, please let me know.


Friday, February 14, 2020

Child Suicide: Age and Sex

Child Suicide: Age and Sex


Note: this is part of the Youth Suicide Rise project.


Child suicide is unsurprisingly more common the older a child is, but a lot more boys than girls kill themselves and suicide age patterns differ considerably between boys and girls.

Age


Nearly all (93%) child suicides between 1999 and 2017 were committed by teenagers:


The initial doubling of suicides with each additional year of age slows down during teenage years:


Here the blue is suicides in the age group a year younger, red is additional suicides, and the yellow line shows the ratio between suicides in consecutive age groups.

Sex


Boys kill themselves nearly three times as often as girls: there were 15,836 male suicides versus 5,658 female suicides under the age of 18 between 1999 and 2017 (a ratio of 2.8).

Similarly, the suicide rate for boys is about 2.7 as large as the rate for girls (there are about 5% more boys then girls, so the rates ratio is slightly lower).

Sex and Age


There is an important difference between boys and girls regarding their age of suicide: female child suicides peak at age 16, while male suicide at age 17 is far more likely than at age 16.

Indeed suicide rates remain similar for girls between ages 15 and 17 while they double for boys:


The differences in age patterns can be seen in the curve displaying the ratio of suicide rates between boys and girls:


Suicide among boys is therefore twice as likely during early teens, yet increases to being close to 4 times as likely by age 17.


Notes:

Apparently the 'natural' sex ratio is about 105:100, which fits CDC data very well.

CDC has data only on 'sex' (presumably as biologically determined at birth) rather than on 'gender' (as in psychologically determined by the mind of the child).

The sex and age patterns above apply only to recent USA data -- other nations may have significantly different patterns in their child suicide data.

The two youngest suicide victims in the CDC 1999-2017 data were ages 5 in 2003 (drowning) and 2008 (suffocation); it is unclear to me how it was possible to determine suicidal intent at age 5, especially when manner of death was drowning. There seems to be no relevant information online about either of these two cases.


Wednesday, February 12, 2020

The Rise In Historical Context


The Rise In Historical Context


Note: this is part of the Youth Suicide Rise project.


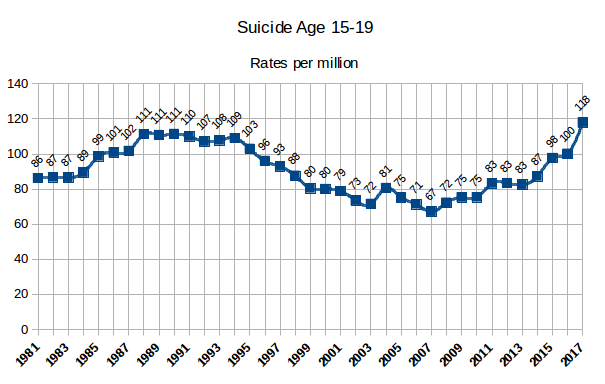
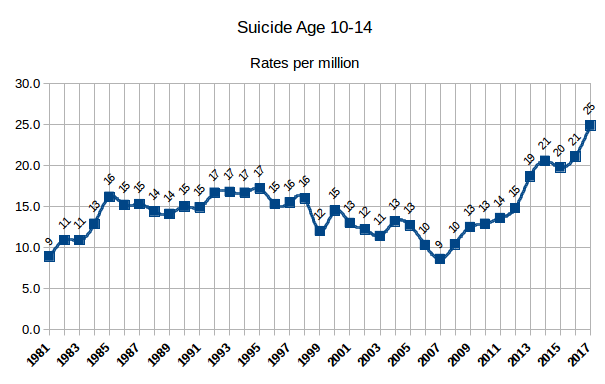
Let us now examine the recent rise in its historical context by looking at rates from the 1990s and 1980s.  

There are, however, two complications.

First, CDC data used ICD-9 Codes until 1998.  ICD stands for International Statistical Classification and the transition from ICD-9 to ICD-10 may affect counts due to coding artifacts

Fortunately a table of ICD–10 and ICD–9 comparability ratios provided by CDC indicates that the 'death by suicide' category was not affected (comparability ratio 1.0022).

A second complication is that the CDC tool does not allow Custom Age Selection on the ICD-9 data form, so we are stuck with Age Groups 10-14 and 15-19.

This is not a terrible drawback; we will just look at historical rates for 'teens' (15-19) and 'tweens' (10-14) separately:


As we can see, 'teen' rates only recently climbed to levels comparable to those in late 1980s to early 1990s; indeed the entire period 1985-1995 has rates as high or higher as we have had only since 2015.

For the 'tween' category, on the other hand, the rates are higher, since 2013, than at any time since 1981. 

Furthermore, if the current upward trend in teen suicide continues or even remains at the 2017 level, we may enter a period of time when teen suicide rates will be considerably higher than at least since 1981.


Notes: 


There are massive differences between teens in 1980s to 1990s and teens today in terms of risk behaviors related to violence and drug use; we will look at this issue later.

Increasing willingness to classify deaths of children as suicides may be affecting younger age groups the most; we will also look at this issue later.

A few methods of suicide do have comparability ratios significantly different from 1, e.g. Unspecified Mechanism (1.7) and Other specified Mechanism (1.2) and even Cut or Pierce (0.87).  All others are between 0.9 and 1.1 -- viz the CDC comparisons table.

The CDC ICD-9 data form goes back to 1981, thus this is our starting point.


Monday, February 10, 2020

The Youth Suicide Rise: Rate Anomalies


The Youth Suicide Rise: Rate Anomalies


Note: this is part of the Youth Suicide Rise project.


The large increase in 2008 brings up another issue to consider: anomalies.

An abnormal event having a strong but short-term effect may need to be analyzed separately when we examine a long-term trend such as the doubling of child suicide.

Let us look again at a graph of proportional changes, this time with direction of change preserved:


We can see that both 2007 and 2017 indicate large proportional changes -- in opposite directions -- from previous year.

Time Period Endpoints


Could it be that the endpoints of our doubling period 2007-2017 were affected by two distinct abnormal events that inflated the long-term trend?

After all, the rates in 2007 and 2017 equal the minimum and the maximum in our data, respectively.

If we look again at the yearly rates graph, however, we will notice a good reason to doubt this possibility, as both 2007 and 2017 fit well with the preceding trend in the graph:


Let us therefore examine how the actual rate each year differed from the rate predicted by the trend set by the previous two years:


For example, the 'expected' rate in 2017 would be 20.8 + (20.8 - 19.0) = 22.6; the actual rate of 24.1 therefore exceeded the predicted rate by less than 7%.

We can see that the year 2017 is unremarkable once trend is taken into account, and that the year 2007 fits its preceding trend perfectly.

The Great Recession


The abnormal event affecting the year 2008 was obviously the Great Recession.  The decrease in the upward trend from 2008 to 2009, and the actual decline in the number of suicides in 2010, are consistent with the economic crisis having strong short-term effects.

It is important to keep in mind, however, that correlation and plausibility are far from causality and proof -- we will analyse links between the recession and child suicide in depth later.

2011


The strong increase in 2011 was followed by 6 years of further increases, so the evidence here does not support an abnormal event with short-term consequences.  Rather, the large increase in 2011 might be better explained as being due to the combination of a rising long-term trend with a rapid recovery from the recession.

Time Period Start: 2007 or 2010?


If the recession affected strongly the years 2008 and 2009, and has unknown long-term effects -- young children experiencing traumatic events such as a parent becoming unemployed or the family house being foreclosed -- the question arises: should we restrict our attention only to developments after 2010?

My view is that unless we can reliably estimate long-term effects of the recession, we should consider both the minimal (negligible recession effects on 2017) and maximal (recession effects remaining at 2010 levels) possibilities and see if a theory is plausible for both, one, or neither scenario.


Notes:


As before, we avoid more advanced statistical tools since their use on so sparse a data set may only lead to a false sense of sophistication.

For those interested, see  How To Identify Patterns in Time Series Data: Time Series Analysis.  If anyone can demonstrate that a more advanced statistical analysis would benefit the discussion in this post, please let me know.

2001 and 2004


The candidate for an abnormal event in 2001 is obviously 9/11.  It may seem paradoxical that such an event could lead to a decrease in suicides, but this was predicted more than a century ago by Ă‰mile Durkheim, who noticed that suicide rates are higher in times of peace than in times of war, perhaps due to a 'group cohesion' element countering what Durkheim termed Egoistic suicide.

In 2004, there was a widespread media coverage of studies linking antidepressants to suicidal behavior of adolescents, a concern that culminated with a controversial decision by FDA to require 'black-box' warnings. Somewhat paradoxically again, the consequent decrease in the use of antidepressants has become a suspect for the following spike in adolescent suicides, though it remains unclear if this would have been due to discontinued use rather than due to decrease in new users (a crucial distinction).

None of the above is to imply we have a proof that either of the events explains the trend shift in child suicides in its year -- just the relatively late occurrence of 9/11 within the year should give one a pause.  What I've seen so far published on the subject is mixed and limited in scope.


Friday, February 7, 2020

Youth Suicide Rise: Rate Fluctuation


Youth Suicide Rise: Rate Fluctuation


Note: this is part of the Youth Suicide Rise project.


Could the doubling of suicide rates within a decade be the result of natural fluctuation within the data?

Given the limited amount of relevant data, separating systematic patterns from mere 'random noise' is essentially impossible.  It is possible, however, to estimate reasonable upper bounds on the role of chance by examining year-to-year fluctuation.

Let us start by looking at child suicide rates since 1999:


We see there does not appear much volatility in the graph -- indeed both the mean and the median of the year-to-year changes is a little over 1 death where values range from 11 to 24 deaths (per million).

Since the difference between 2007 and 2017 amounts to 13 deaths, it is roughly 10 times as large as the average change between years.

To see this better, let us look at the magnitudes of year-to-year changes:


The light blue is the magnitude of the positive or negative change, the dark blue the yearly rates.

Note that the largest change (3.3 deaths) occurred after rates rose greatly, so it is only 15.9% of the preceding year rate.

We can see that year-to-year changes are a small fraction of of the preceding year: 


Here I deliberately left the scale maximum at 100% as that represents the rate from the previous year while the value displayed describes the fraction of this (expressed in percents) that equals the (absolute) difference between the two years.

The average change is about 8% from the previous year, and never went above 20%.

The proportionally largest change occurred in 2008 with a 17.7% jump above 2007.  Therefore the doubling between 2007 and 2017 amounts to about 6 times the year-to-year maximum proportional change on record.

Another method to differentiate short-term fluctuations from long-term trends is to look at aggregate data over a longer time period.

Let us begin with the average of rates over 5-year periods:


We can see that the suicide rate jumped more than 50% from 2003-07 to 2013-17.

Finally, we can also look at 5-year averages:


We now see a very stable upward trend since the 2006-10 interval -- except that it seems to be slightly accelerating at the very end.

We can see that 3-year intervals also give a very smooth trend (since 2007):


To summarize, the U.S. is so large a country that there is not enough fluctuation in yearly child suicides to justify the dismissal of the 2007-2017 doubling as being largely the result of mere chance.


Notes:


Admittedly, the conclusion is fairly obvious from just looking at the first graph of child suicide rates each year.  We will soon, however, encounter data where fluctuations can be far more important, such as when we examine suicide rates of young girls or suicide methods resulting in deaths.  The above is thus useful in getting familiar with the methods involved, and in a manner easily comprehensible by even those readers who know nothing about statistics.

On the other hand, we also avoided more advanced statistical tools -- with only 15 data points the use of more sophisticated methods may mislead rather than enlighten. 

The role of anomalies within the 2007-2017 period is a separate issue, with 2008 being an obvious example.  We will look at anomalies a bit closer in the next post.


Technical Notes:

I start with 1999 because that is the first year available under the ICD-10 classification that CDC displays by default and going further back would offer little additional advantage.

When examining natural fluctuations, it needs to be kept in mind that these can also be affected by time -- think of the rapidly increasing child population in the 1960s -- and therefore the consideration of periods before 1999 may lead to needless complications rather than insight.

We will of course look at data from earlier time periods soon, once we move on to examine historical context.

The average of rates over N years is not the same as the rate for the N years period.  In fact 'population' any given year is not in itself a well-defined concept, but this does not matter much if the counting method is consistent over the years and there are no extreme changes in population.

Similarly, the rate over a 5-year period may be computed differently depending on its definition; usually though we multiply each yearly rate by its population, then divide by all populations total.

In our case the population has varied only slightly (namely by less than 1% from year to year) so we need not worry about these details.

The rate values are rounded to single decimal digits when displayed, but not when used in calculations; therefore the percentage changes may differ slightly from those that would be computed with the rounded values shown in the first graph.

The graphs were produced by the free and open-source LibreOffice software.  I admit part of the reason behind the graphing bonanza above is that I am getting familiar with the Chart feature of LibreOffice Calc -- so far I like the crisp look of the graphs.

Data Sources:


Tuesday, February 4, 2020

Child Suicides Double in a Decade


Child Suicides Double in a Decade


Note: this is part of the Youth Suicide Rise project.


The number of children who have killed themselves has more than doubled between 2007 and 2017.

According to CDC data, 838 minors killed themselves in 2007 while in 2017 the death toll rose to 1778 deaths.  We are getting close to a thousand additional deaths every single year when compared to 2007.

The decade that followed 2007 accounted for more than 4000 additional suicide deaths of children.

The doubling is true of child suicide rates as well: from 11 to 24 deaths per million persons under the age of 18 between 2007 and 2017 (the overall number of minors has been mostly decreasing since 2010).

These troubling statistics come from the National Center for Injury Prevention and Control:


With the exception of a slight decrease in 2010, there has always been a year-to-year increase since 2007.

The doubling of child suicide rates is a far greater increase than the roughly 20% rise in adult suicide rates between 2007 and 2017.

While suicide rates for boys doubled, suicide rates for girls were closer to tripling than doubling.

Younger kids were impacted more than older kids and rates for females under 16 nearly tripled.


These stark facts reflect tragedies that ripple through families and communities in increasing numbers, a phenomenon that is so poorly understood that hardly any expert is willing to offer definite answers as to why youth suicide has been rising so steadily and significantly for a decade.

We will soon look at the available data in more detail.


Notes:


The data is accessible from the Fatal Injury Reports tool at the CDC website.

The latest available data is from 2017.  I will do an update once 2018 data is released.

The more than 4000 'additional' suicide deaths is based on the total of 13,494 child suicide deaths in 2007-2017 minus 11 times the 838 deaths in 2007.

As this is meant to be merely an overview, I do not include all the relevant data and computations.

A legitimate question is to what degree the CDC data can be trusted to accurately reflect reality.  At this point I have no reason to believe the CDC data differs greatly from reality and certainly no reason to think it differs so strongly that it would render the doubling of suicide among kids largely an illusion. 

I will revisit the issue once I finish posting analysis of the available data, as that may increase the chances of getting replies from both CDC and relevant experts regarding any possible problems with the CDC data collection process.

As to decisions made about the classification of deaths as suicides, which precedes data collection, I will argue later that this may indeed be a significant factor regarding younger adolescents -- but not so strong a factor as to invalidate massive increases in teen suicides.

Other legitimate issues include the possibility of the 2007 data being an anomaly that skews comparisons with the past -- we will examine this and other matters soon.


CDC and YRBS: Time for Transparency

   CDC and YRBS: Time for Transparency This post is related to the  Youth Suicide Rise  project CDC response to Washington Post questions re...